Perfhawk
A local-first profiling workbench for Go and .NET — attach to a running process, explore flame graphs, GC and diffs in your browser, and keep every profile on your machine.

Perfhawk
Find out why your Go or .NET app is slow — without sending a byte anywhere.
Attach to a running process (or import a profile file) and explore flame graphs, a call graph, GC behaviour, before/after diffs and plain-language findings in your browser.
⬇️ Download · Source on GitHub · Quickstart · User Guide · Report an issue
Status: v0.1, Windows first. Linux and macOS are next. See the known limitations.
Why this project was needed
Profiling is one of those jobs where the tooling is scattered. Go has pprof, .NET has dotnet-trace and PerfView, each with its own viewer, its own file format and its own way of reading a flame graph. Hosted continuous profilers are great in production, but they need an account, an agent and a network path — a lot of ceremony when you just want to know why this build on this laptop got slower.
And once you have a profile, the hard part starts: which function is the real problem, is that number even trustworthy, and did my fix actually help?
Perfhawk is the opposite of a production service. It is a workbench for on-demand investigation on a developer machine: one workflow for several languages, a UI that answers questions instead of only drawing pictures, and nothing that leaves your computer.
- 🔀 One workflow, several languages — Go and .NET record into the same model and open in the same UI. Import pprof, collapsed stacks, speedscope and
.nettracefiles too. - 🎯 Zero-config recording —
perfhawk record --pid <pid>for .NET. For Go, add one import line, or point it at an existingnet/http/pprofendpoint. - 💡 Answers, not just pictures — flame graph, Top, sandwich, call graph and a time heat map, plus a Findings panel that says where to look.
- ♻️ Garbage-collection analysis — collections per generation, pause times, heap size and allocation rate, with findings for long pauses and heaps that keep growing.
- ⚖️ Compare anything — diff two profiles or two time windows.
perfhawk checkexits non-zero when a function got slower, so it can gate CI. - 🔒 Private by design — local store, server bound to
127.0.0.1, no telemetry, no account. - 🧮 Honest numbers — every profile carries a fidelity badge (native, approximate, derived) so you know how far to trust it.
Perfhawk is not a continuous production profiler. For that, look at Pyroscope, Parca or Grafana Cloud Profiles.
How it works
- Record or import — attach to a running process, or import a profile file you already have.
- Everything lands in one local store — Go and .NET profiles share a single model, grouped into sessions.
- Open the browser UI —
perfhawk uiserves a workbench on127.0.0.1: a Summary with findings first, then flame graph, call tree, timeline, call graph and GC. - Compare and gate — diff before and after, or run
perfhawk checkin CI.
Install
Windows 10/11 (x64) — PowerShell, no administrator rights needed:
irm https://github.com/rajkumarGosavi/perfhawk/releases/latest/download/install.ps1 | iex
The script downloads the release zip, verifies its SHA-256 checksum, unpacks it to %LOCALAPPDATA%\Programs\perfhawk and adds that folder to your user PATH. Then open a new terminal:
perfhawk --version
perfhawk targets                             # what can Perfhawk see?
perfhawk record --pid 1234 --duration 15s    # .NET 8+: no code change needed
perfhawk ui
| Platform | Status | Get it |
|---|---|---|
| Windows 10/11 (x64) | v0.1 | Download |
| Linux | planned (eBPF-based OS tracing) | Roadmap |
| macOS | planned | Roadmap |
| You want to… | You need |
|---|---|
Import files, browse the UI, diff, run perfhawk check | Nothing else |
| Record .NET | A running .NET 8+ app. The recording helper is bundled; no SDK needed |
| Record Go | Go 1.22+ and one of: the Perfhawk agent in your app (import _ "github.com/rajkumarGosavi/perfhawk/agents/go"), a net/http/pprof endpoint, or perfhawk record --go-test <pkg> |
“Is this safe? Windows warned me.”
Perfhawk attaches to other processes, which is exactly what security software watches for, and v0.1 binaries are not code-signed yet. Windows SmartScreen may show an “unknown publisher” prompt: click More info → Run anyway. That is a reputation prompt, not a virus detection, and code signing is on the roadmap.
Why you can trust it anyway:
- Nothing phones home. No telemetry, no analytics, no account. The UI server listens on
127.0.0.1only and rejects other host names (DNS-rebinding protection). - Open source (Apache-2.0). Read it, build it yourself, or verify the SHA-256 checksum published with each release.
- Profiles stay in a local folder you can delete at any time.
Screenshots
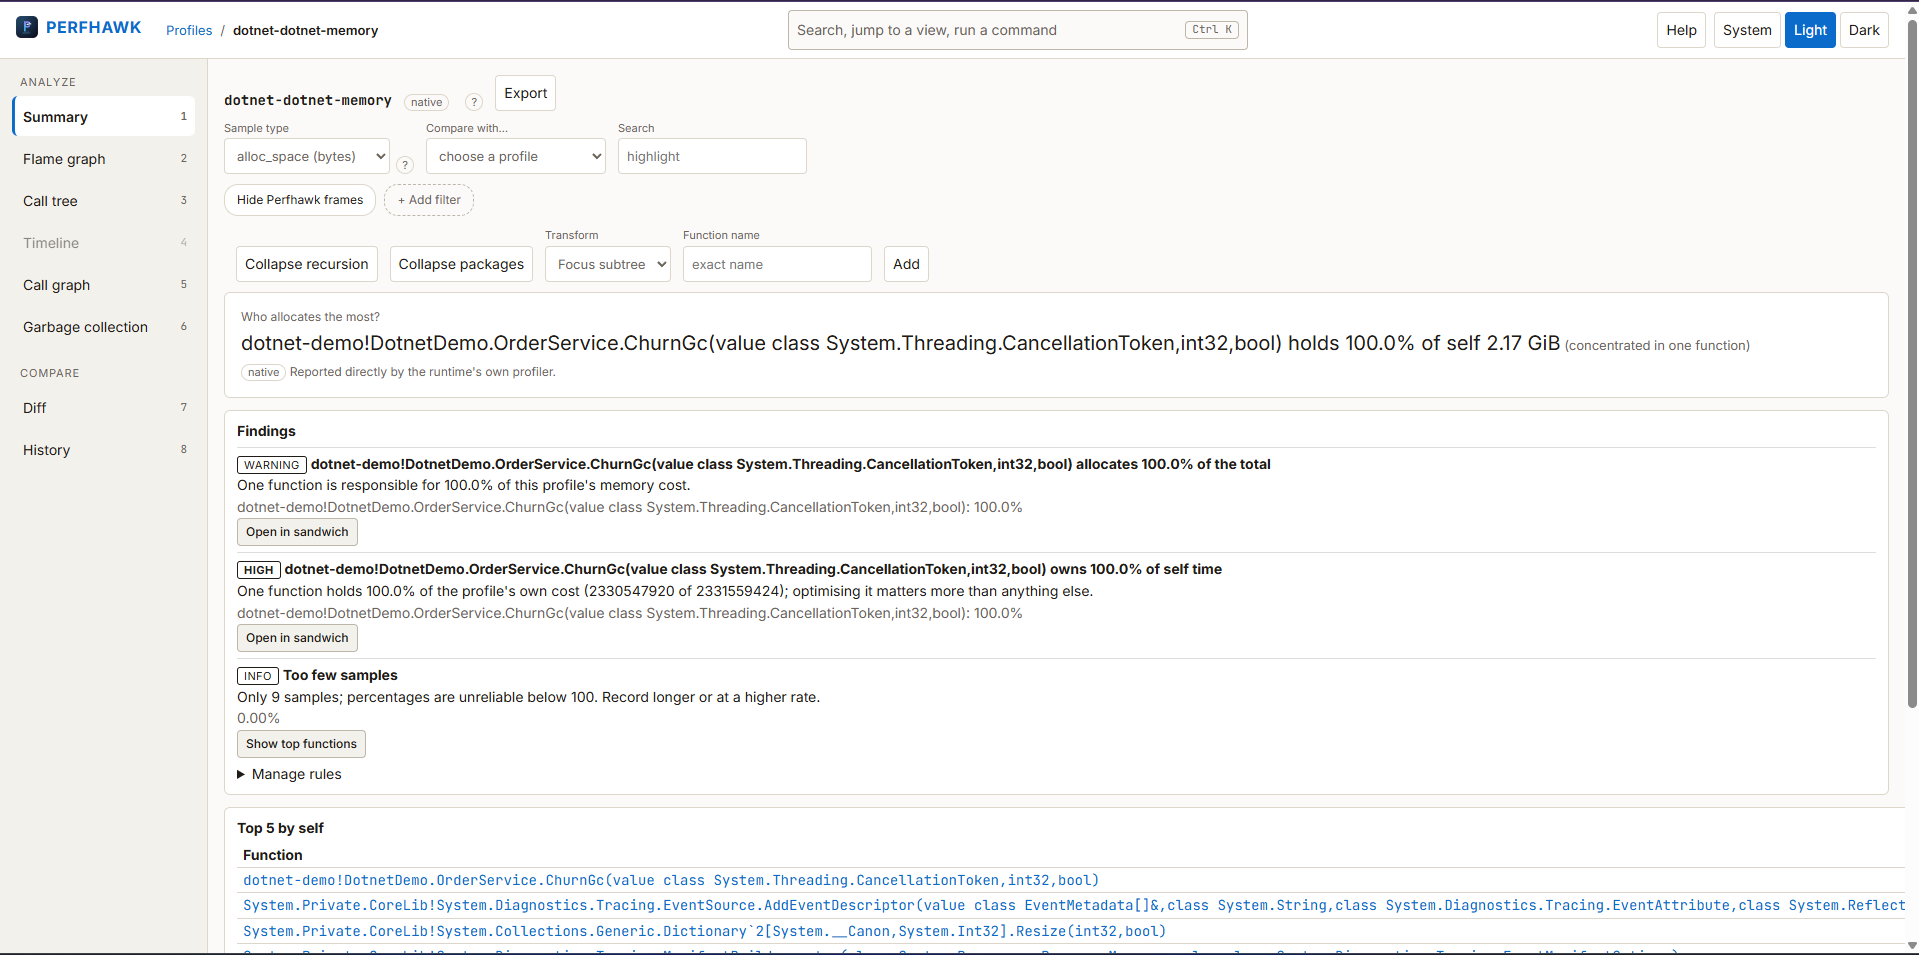
Summary — findings first
Open a profile and the Summary tells you where to look: the function that owns the most cost, ranked findings with the evidence behind them, and the top functions by self and total.
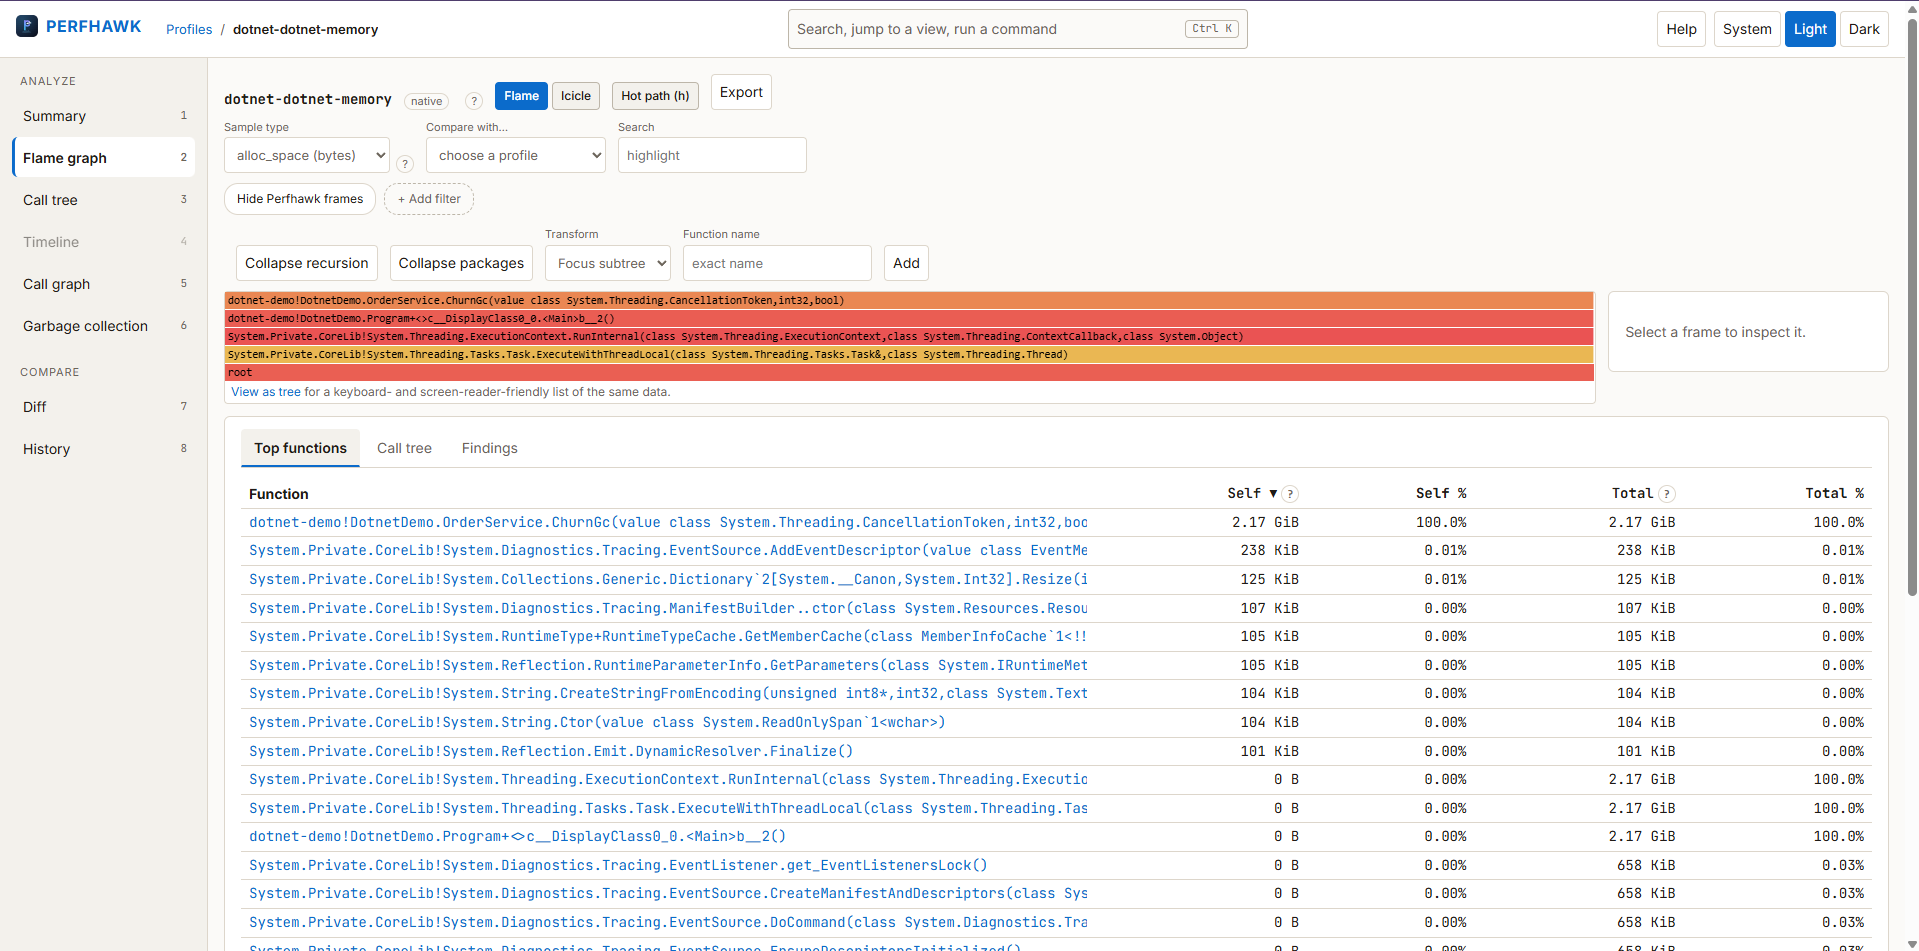
Flame graph workbench
A flame graph with an inspector beside it, and Top functions, Call tree and Findings tabs underneath — plus a timeline range strip and filter chips to narrow what you are looking at.
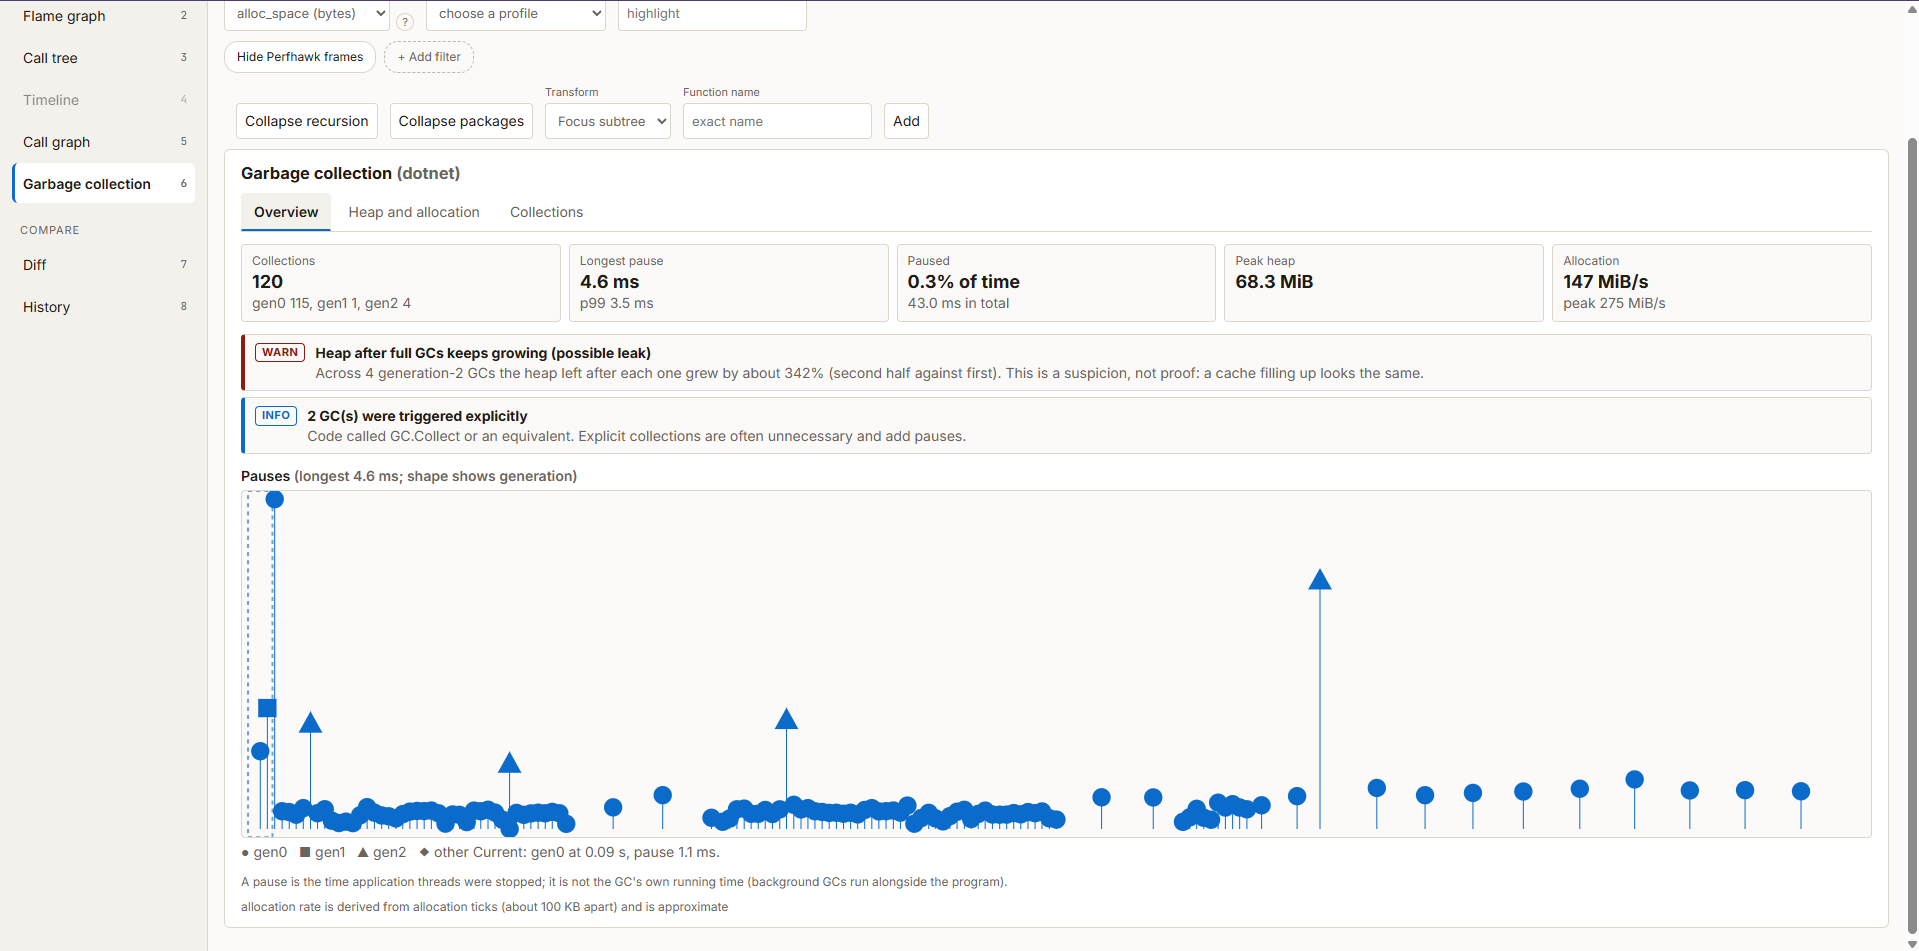
Garbage collection
For .NET targets, Perfhawk records GC events and shows collections per generation, pause times, peak heap and allocation rate. Findings flag a heap that keeps growing across full GCs (as a suspicion, never a verdict) and explicit GC.Collect calls.
Built with
Rust (capture, store, analysis and the local server), a React + TypeScript UI embedded into the binary, a Go agent, and a .NET helper that reads EventPipe traces. On Windows it can also use ETW to trace block I/O, off-CPU time and scheduler delay for a single process.
What’s next
- Go GC analysis, with the same views .NET has today
- Linux and macOS builds, with Linux eBPF tracing
- Code-signed Windows binaries and a winget/Scoop package
Feedback and bug reports are very welcome on GitHub.